Desmos: Generating Straight Lines
In this tutorial you use the Desmos API to create an app that generates random straight lines on a set of axes. Clicking the Next button generates a new line. The finished app is shown in the figure below and you can see it in action on JS Bin.
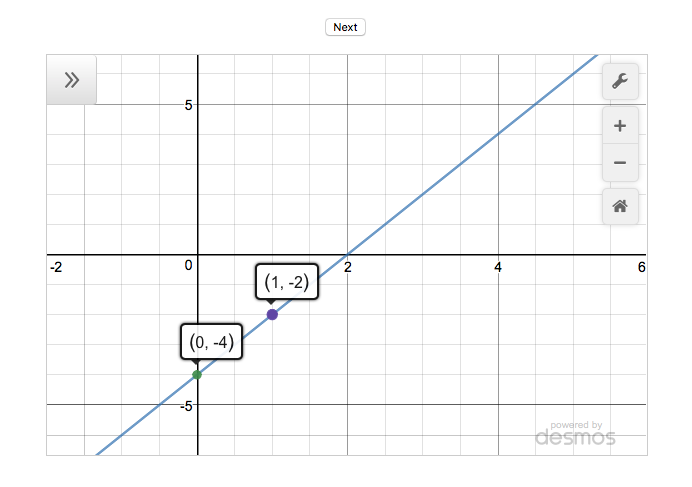
The app also shows two points on the line. Clicking the points displays their coordinates. In this first version of the app, the x values of the two points will always be 0 and 1. That makes it easy to see the y-intercept and to calculate the gradient of the line.
Step-by-step
To create the line generator app, you'll follow these steps:
- Import the Desmos API script
- Use a div element as a container for the calculator
- Create a blank calculator on the page
- Add expressions for the calculator to draw
- Link the Next button with a function that generates a straight line
Import the Desmos API script
Desmos makes the JavaScript code for their calculator available on their site. The listing below uses a script element to import the calculator code. The demonstration api key, dcb31709b452b1cf9dc26972add0fda6, is provided by Desmos for use during development. If you plan to use the api in production, you should email info@desmos.com to obtain your own api key.
<body>
    <script src="https://www.desmos.com/api/v0.8/calculator.js?apiKey=dcb31709b452b1cf9dc26972add0fda6"></script>
</body>
Once you import the Desmos code, you can create instances of the Calculator object and use it to display points and graphs. But where does your calculator appear? You'll need a container for that.
Use a div element as a container for the calculator
Add a div element to the app's HTML. Give it an id so you can reference it from your JavaScript code. The next listing shows a div with an id of 'calculator'.
<body>
    <div id="calculator"></div>

    <script src="https://www.desmos.com/api/v0.8/calculator.js?apiKey=dcb31709b452b1cf9dc26972add0fda6"></script>
</body>
With the Desmos code imported and an element waiting to show the calculator, you can create your first calculator and show a graph and points.
Create a blank calculator on the page
With just two lines of JavaScript you will create a fully functioning Desmos graphing calculator and display it on the page. The following figure shows what to expect:
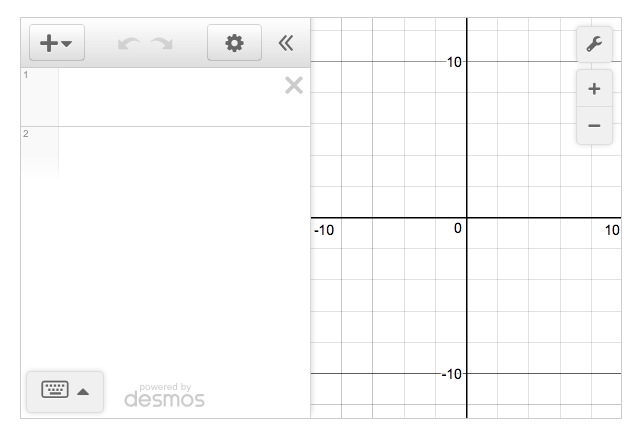
The calculator has an expressions list on the left and a grid for graphs on the right. Both are empty. You can type expressions for points and graphs into the list on the left and they will be displayed on the grid.
This listing shows the two lines of code needed to display the blank calculator:
// get a reference to the div where you want to show the calculator
var elt = document.getElementById('calculator');

// Create a new blank calculator and display it in the div
var calculator = Desmos.GraphingCalculator(elt);First, you get a reference to the div you included in the HTML. You assign the reference to the elt variable. Then you create a new Desmos calculator. You pass it the reference to the div so it knows where to display the calculator. You assign the new calculator to the calculator variable so you can use the calculator later in your code.
Creating a calculator with two lines of code is impressive! But, you want to be able to add points and graphs via code.
Add expressions for the calculator to draw
The Desmos calculator API lets you set expressions in the expressions list. In the next listing you'll add expressions for a line and two points to give the output shown in this figure:
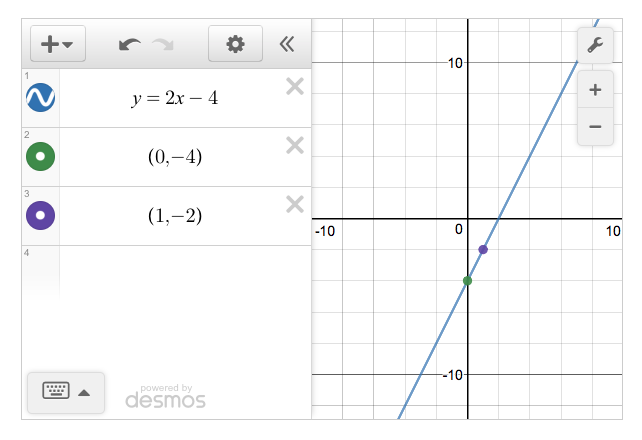
To add expressions to the expressions list, call the calculator's setExpression method.
var elt = document.getElementById('calculator');
var calculator = Desmos.GraphingCalculator(elt);

// Draw a line on the calculator
calculator.setExpression({id:'line', latex:'y=2x-4'});

// Show two points on the line
calculator.setExpression({id:'p1', latex:'(0,-4)'});
calculator.setExpression({id:'p2', latex:'(1,-2)'});
You call the setExpression method three times. You pass it an object (the code in the curly braces) each time. The object contains an id property and a latex property. You use the id to name the expression, so it can be updated or removed later. You use the latex property to specify the point or line to be drawn. (Latex is a language for specifying mathematical expressions in text.)
Great! You can create a calculator and specify expressions to be drawn on the grid, all in JavaScript. The last step is to generate random lines at the click of a button.
Link the Next button with a function that generates a straight line
The listing below includes the full code for generating lines at random. I discuss selected parts of the code in more detail after the listing. This code would be in its own file and you would import it it into your HTML page using a script tag placed after the Desmos API script.
Follow the JS Bin link to see a working version. On JS Bin, the code is placed in the JavaScript panel. You can access the HTML, CSS and JavaScript panels by clicking the 'Edit in JS Bin' link on the JS Bin page.
(function () {
    "use strict";

    var calculator;

    function between (a, b) {
        var range = b - a + 1;
        return a + Math.floor(Math.random() * range);
    }

    function getPoints () {
        return [
            { x: 0, y: between(-4, 4) },
            { x: 1, y: between(-5, 5) }
        ];
    }

    function getGradient (points) {
        return (points[1].y - points[0].y) / (points[1].x - points[0].x);
    }

    function pointString (point) {
        return '(' + point.x + ', ' + point.y + ')';
    }

    function lineString (points) {
        var line = "y = ";
        var gradient = getGradient(points);
        line += gradient + 'x+';
        line += points[0].y;

        return line;
    }

    function showLine (points) {
        points.forEach(function (point, i) {
            calculator.setExpression({id: 'p' + i, latex: pointString(point)});
        });

        calculator.setExpression({id:'line', latex:lineString(points)});
    }

    function next () {
        showLine(getPoints());
    }

    function init () {
        var elt = document.getElementById('calculator');
        calculator = Desmos.GraphingCalculator(elt);

        document.getElementById("btnNext").addEventListener('click', next);
    }

    init();
})();
Generating two points and finding the gradient
The getPoints function returns an array of two points. The points are JavaScript objects with x and y properties. The function generates the y properties using the between function.
If you assigned the points array to a variable called points, you could access each point using square brackets. The first point in the array is points[0] and the second is points[1]. (Array indexes are zero-based.)
var points = getPoints();

// first point
points[0];   // e.g. { x: 0, y: 4 }

// second point
points[1];   // e.g. { x: 1, y: 5 }
Access the x and y properties using dot notation.
var points = getPoints();

// first point
points[0].x;   // 0
points[0].y;   // 4

// second point
points[1].x;   // 1
points[1].y;   // 5
The gradient of a straight line is given by the 'change in y' divided by the 'change in x'. The getGradient function uses the array of points to calculate and return the gradient of the line through the two points.
function getGradient (points) {
    return (points[1].y - points[0].y) / (points[1].x - points[0].x);
}
The equation of the line
You can write the equation for all of your generated lines in the form y = mx + c, where m is the gradient of the line and c is the y-intercept, the y value of the point on the y-axis that the line passes through.
The getGradient function calculates the gradient and the y-intercept is just points[0].y, where points is the array holding both points on the line.
The lineString function builds the equation of the line, using the gradient and y-intercept.
function lineString (points) {
    var line = "y = ";
    var gradient = getGradient(points);
    line += gradient + 'x+';
    line += points[0].y;

    return line;
}
Updating the expression list
Once you have the equation of the line (and strings for the two points), you update the Desmos calculator, setting three expressions: one for each point and one for the line.
function showLine (points) {
    points.forEach(function (point, i) {
        calculator.setExpression({id: 'p' + i, latex: pointString(point)});
    });

    calculator.setExpression({id:'line', latex:lineString(points)});
}
Every time you call showLine, it uses the same id values for the three expressions; any previous expressions using those id values will be updated. That's exactly what you want. Every time the Next button is clicked, the expressions are updated and the calculator shows a new graph.
Congratulations! You have a working straight line generator that uses the Desmos API.
What's next?
In part 2, you add the ability to create a set of random straight lines and navigate between them. You also see how to better customise each Desmos calculator you create.
Find out more about Desmos
See the calculator (and a lot more) in action at desmos.com
Investigate the API at desmos.com/api
Get Programming with JavaScript
Keep learning! Get Programming with JavaScript is published by Manning and available in print and as an ebook.